
Hand on heart, this is a family tree chart based on the plot of a well-known series of novels and TV adaptation.
Look closely!
I found myself breaking out in a cold sweat when I realised the DNA implications…

Some of you will know the series as soon as you look at the chart. Please don’t give it away in the comments in case it might spoil the enjoyment of someone yet to read it!
The rest of the trees in this post are genuine. The next three are from my own family tree. There’s something unusual about each of them. If you’re not practised at interpreting the symbols on family tree charts, look at each one to work out what’s happening before reading the explanation below each chart.
What’s happening here?

Explanation: Joseph was married to Susanna and was widowed in 1865 when Susanna died. Jane was married to William and was widowed in 1872 when William died. After this, Joseph and Jane met, and they married in 1873. Through them, two of the children from their first marriages also met, and they married in 1874. So the children of this married couple are also a married couple.
What’s happening here?

Explanation: Edwin and Mary Ann had two children, Frederick and Ada Harriot. Frederick had a daughter: Ada Mary. His sister, Ada Harriot married Richard Barton. Ada Harriot died in 1887. Four years later Richard remarried. His new wife was his niece-by-marriage, Ada Mary. Richard’s older children by his first wife are cousins of their new stepmother. They are half siblings and first cousins once removed to the children of that second marriage. The late Ada Harriot is great aunt to the children of her widower’s second marriage.
My natural tendency would be to put a diagonal ‘ = ‘ (indicating marriage) between Ada Mary and Richard on the line above. If I was sketching this out by hand that’s what I would do. However, it wouldn’t be ‘proper’… although I do think it illustrates more immediately what the situation is than this formal version, which keeps to set lines for the generations and has Richard and Ada Mary in their proper places, each therefore appearing twice.
This is an example of an avunculate marriage. It was actually forbidden in England and Wales until two years before Ada Mary’s death – and I suspect the couple knew this, since they married 200 miles from home. The Marriage (Prohibited Degrees) Relationship Act of 1931 removed the barrier to marriage between widowed uncle-by-marriage and niece.
What’s happening here?

Explanation: Harriet had two husbands: Marcus, and then when widowed she married John in 1862. She bore several children within each marriage, including Edward, son of Marcus; and Thomas, son of John.
Edward married (or possibly cohabited with) Jane. After Edward’s death, Jane married (or possibly cohabited with) Edward’s half brother, Thomas. Jane had seven children with Edward and one child with Thomas. This child was half sibling to the others, and also their cousin.
This marriage was also prohibited in England & Wales, until the passing of the Deceased Brother’s Widow’s Marriage Act in 1921. In the particular example above, no marriage record has been found for a marriage between Jane and either brother, so the forbidden marriage situation may not have been an issue.
The next one is based on an online article I saw a couple of weeks ago. You might have realised from the above that I have a fascination with people with multiple connections, and how to illustrate them in a family tree chart.
What’s happening here?
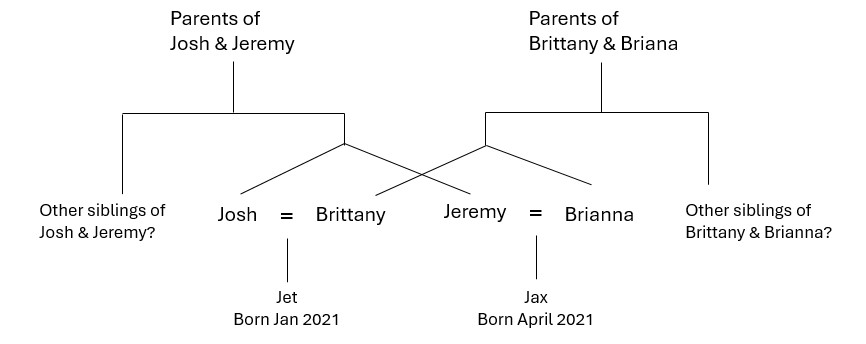
I shared a post about this family on my English Ancestors page on Facebook a couple of weeks ago. Here is a fuller article about the family, from The Independent. Identical twins Josh and Jeremy married identical twins Brittany and Brianna. Each of the couples had a baby early in 2021. As sons of two sets of identical twins (whose genetic information is identical) the children are cousins, but also, since it was exactly the same DNA that created both, they are genetic brothers. If they took an ancestry test they would show as brothers.
There is a serious side to looking at these unusual family trees. They help us to become more practised at using family tree symbols, as well as thinking about the most ‘elegant’ way to illustrate unusual relationships.
All of these family tree charts were drawn using PowerPoint. Doing this provides more control over what you include, and how to illustrate it, than a lot of the tree-building applications on genealogy software or websites. Online family history education providers like IHGS and the Society of Genealogists offer courses and one-off tutorials about using PowerPoint for tree-building. They include the functions of PowerPoint you will use, but also the rules about building pedigree charts, and the information to be included for each person. In the above charts I limited the information included to the story I wanted to tell, but a standard tree chart would include more. We also need to know about the standard abbreviations. In the first chart I had to make up a symbol – the one for ‘several generations between the two people shown’, but the rest are standard. Just a note that in the last tree I didn’t know if the two sets of twins actually have any siblings, but included them as a possibility just to highlight the difference in how we show single births and twins.
Hope you enjoyed. How about you – what unusual connections or multiple connections have you found in your trees?
